Types of Fault Logs
When a fault occurs, the controller records fault information, which is called a “Fault Log.” Fault logs include information as in the table below.
|
System Event |
|
|
Raw Control Data |
|
|
Fault Information |
|
|
Program Running Information |
|
|
System Status Information |
|
Getting the Fault Log List
-
Select Service Tool in the main menu and click the Fault Log Analysis button.
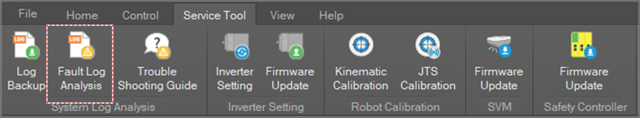
The fault log analysis window will appear.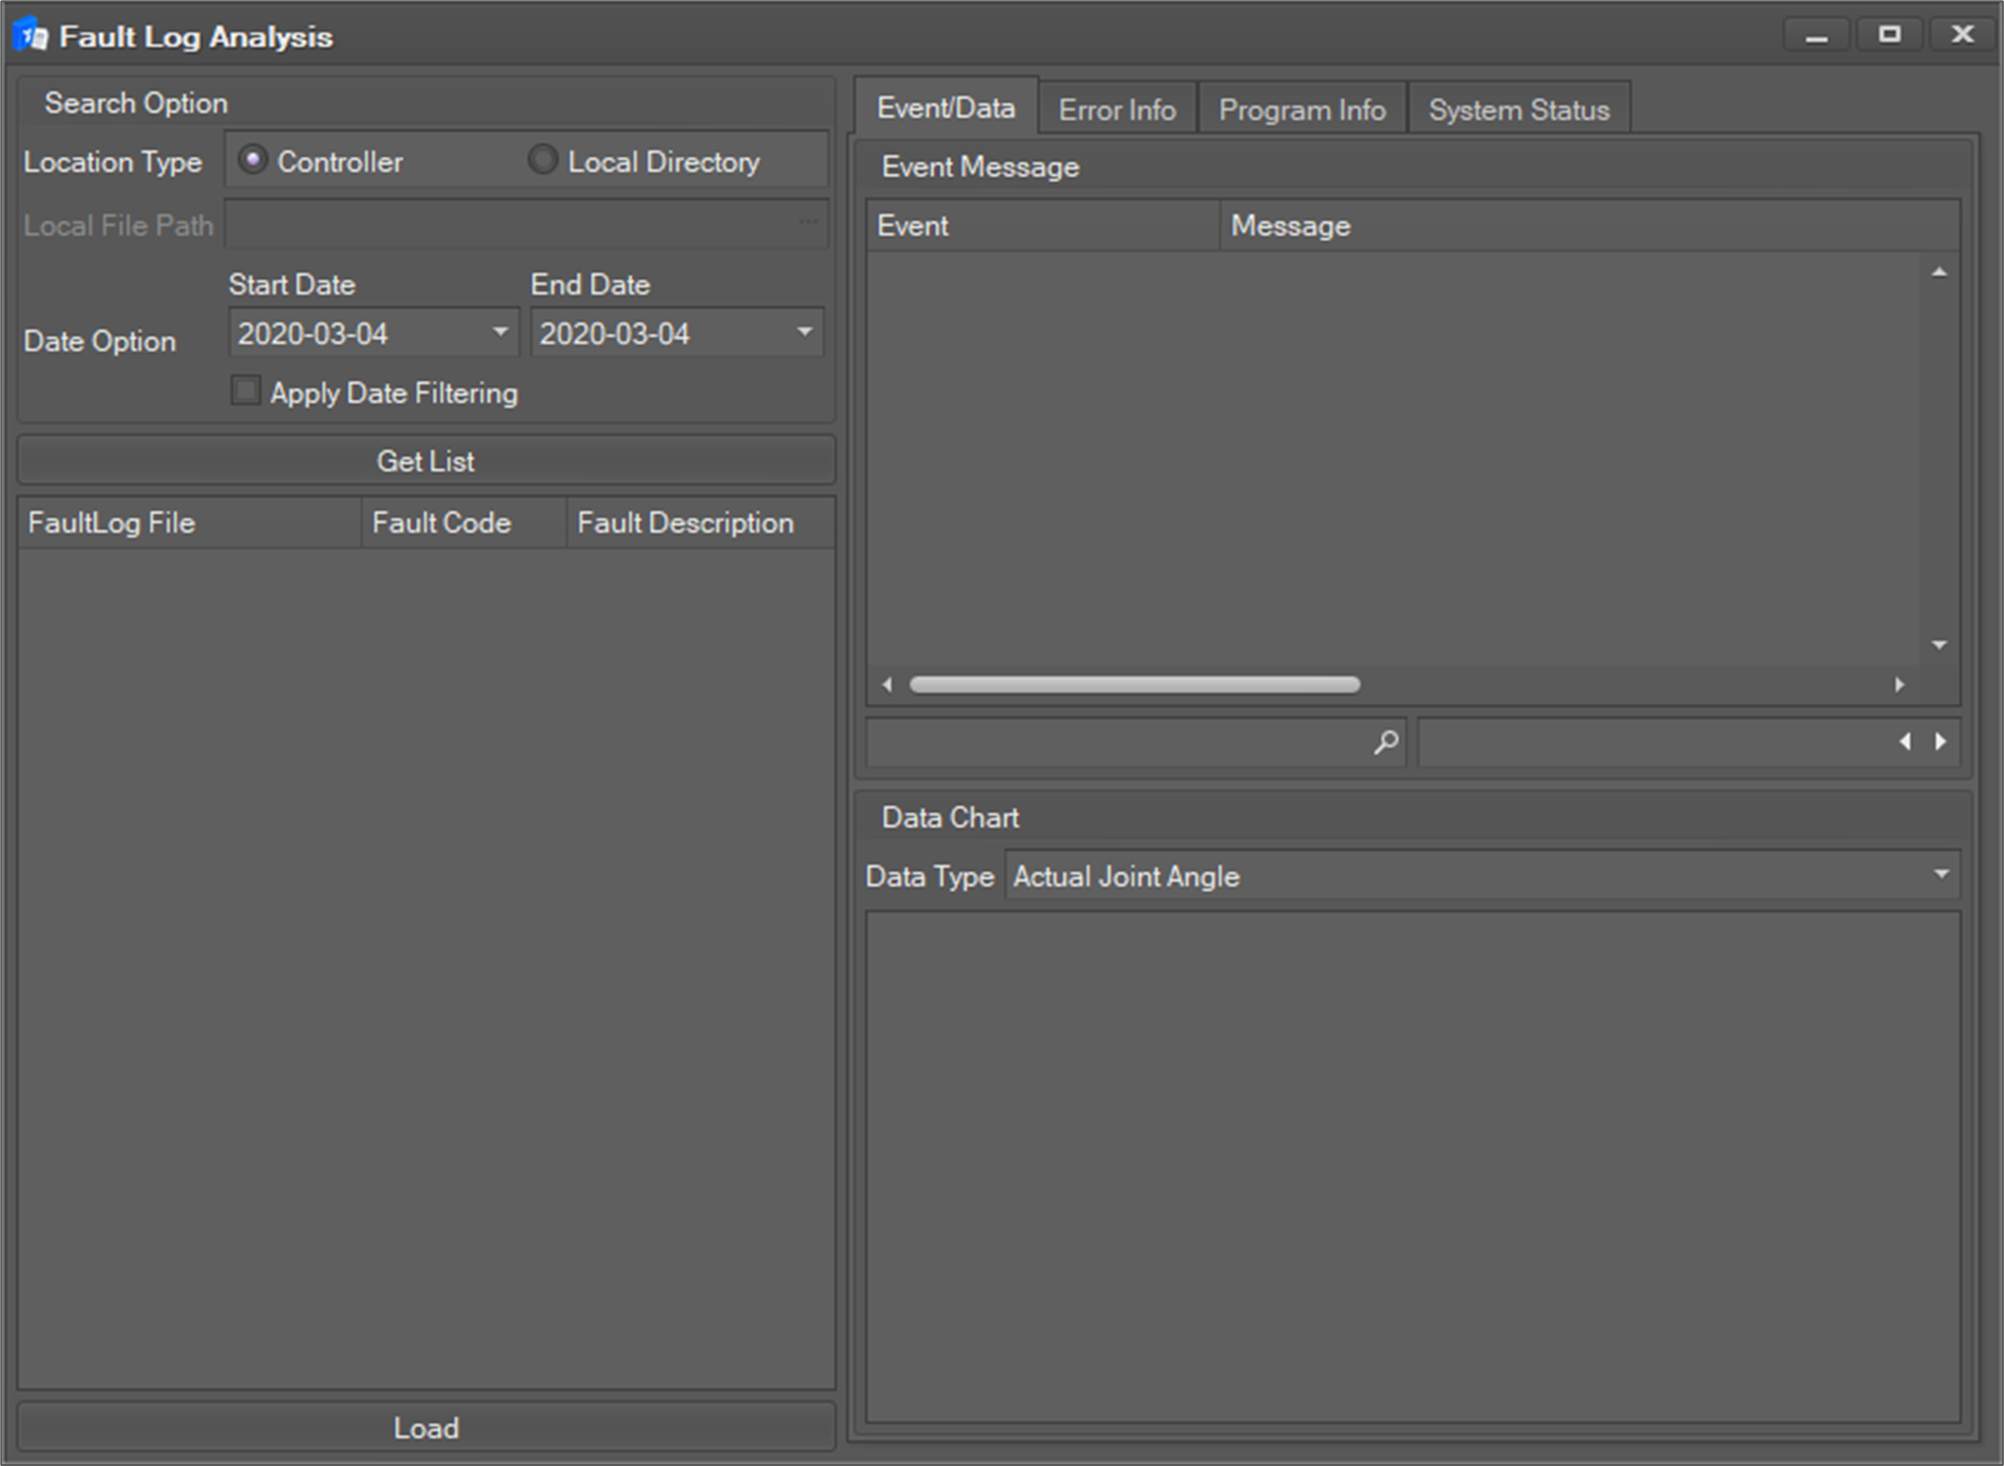
-
Select the fault log location.
-
Controller: logs are loaded from the controller.
-
Local Directory: logs are loaded from the selected local directory.
-
-
Set the date range of fault logs to load. If you do not check Apply Date Filtering, logs from all periods are queried.
-
Click the Get list A list of logs within the date range you selected appears.
You can also filter only the list you want by using the filter

-
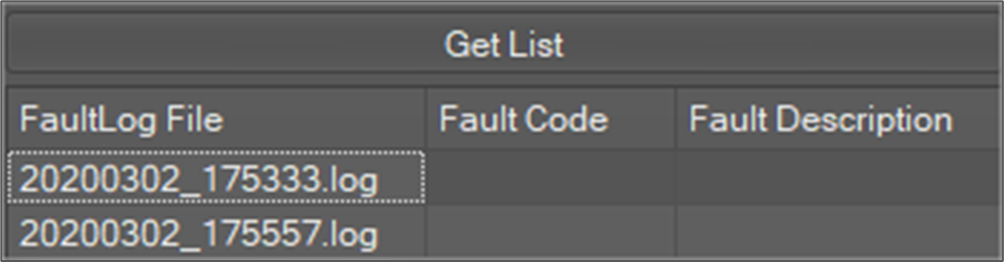
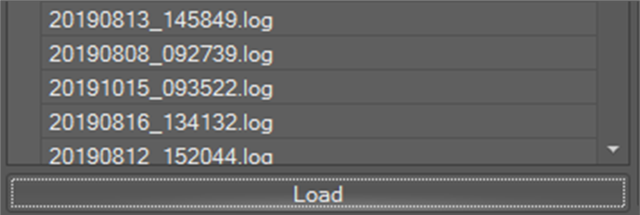
Select a fault log on the list and click the Load button.
-
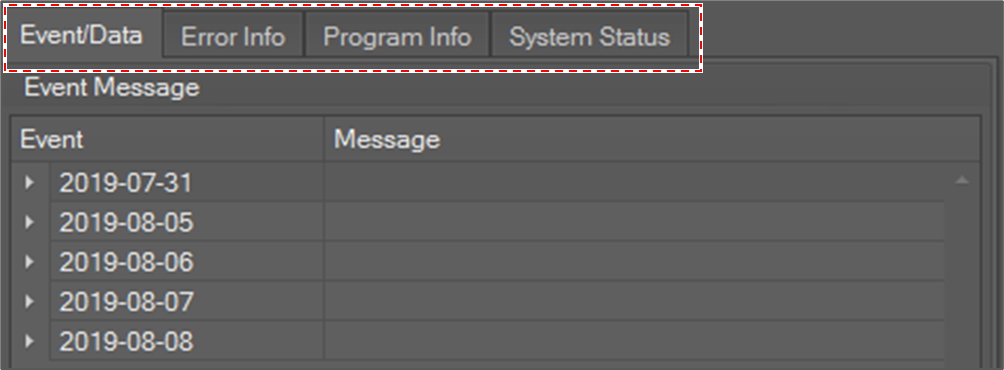
The fault log is loaded and four types of information are displayed in each tab window.
Analyzing the Fault Log
Event Log
Event/Data tab window shows event message and data log.
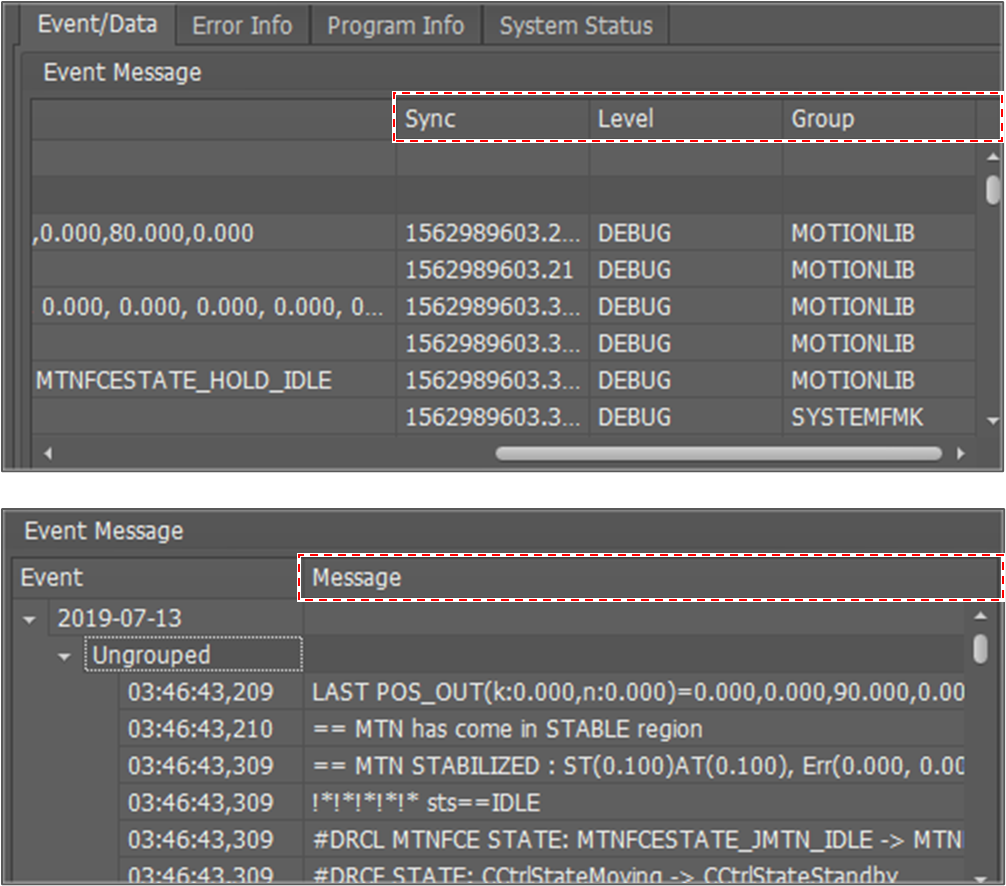
Event logs are structured in a tree in the order of date and program from root. Each event log is composed of Message, Sync, Level and Group.
-
Message: system event message.
-
Sync: logging time in milliseconds.
-
Level: Level of message, with a total five levels: TRACE, DEBUG, INFO, WARNING, ERROR.
-
Group: The software module name that recorded the log.
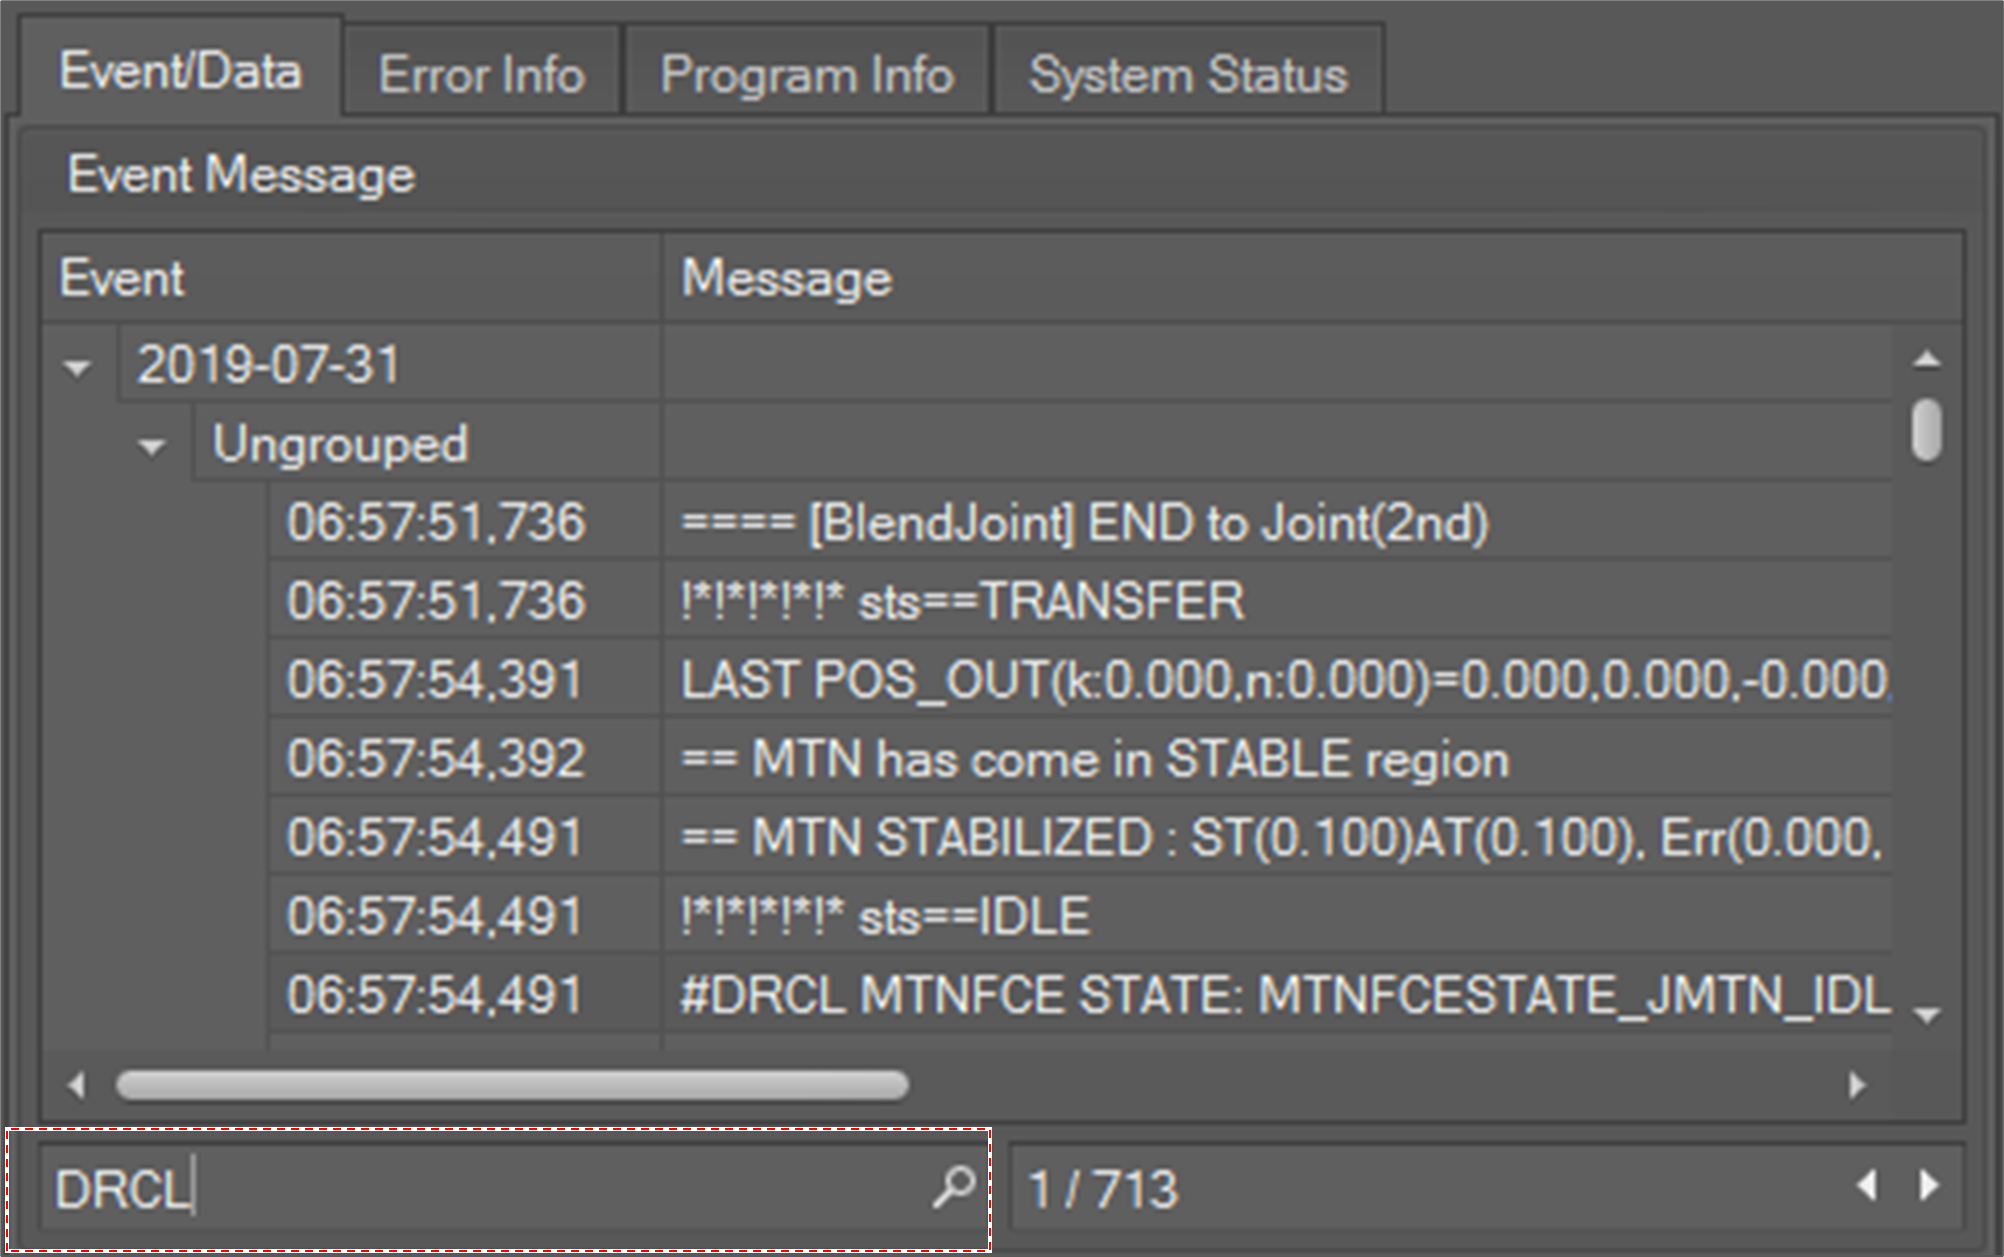
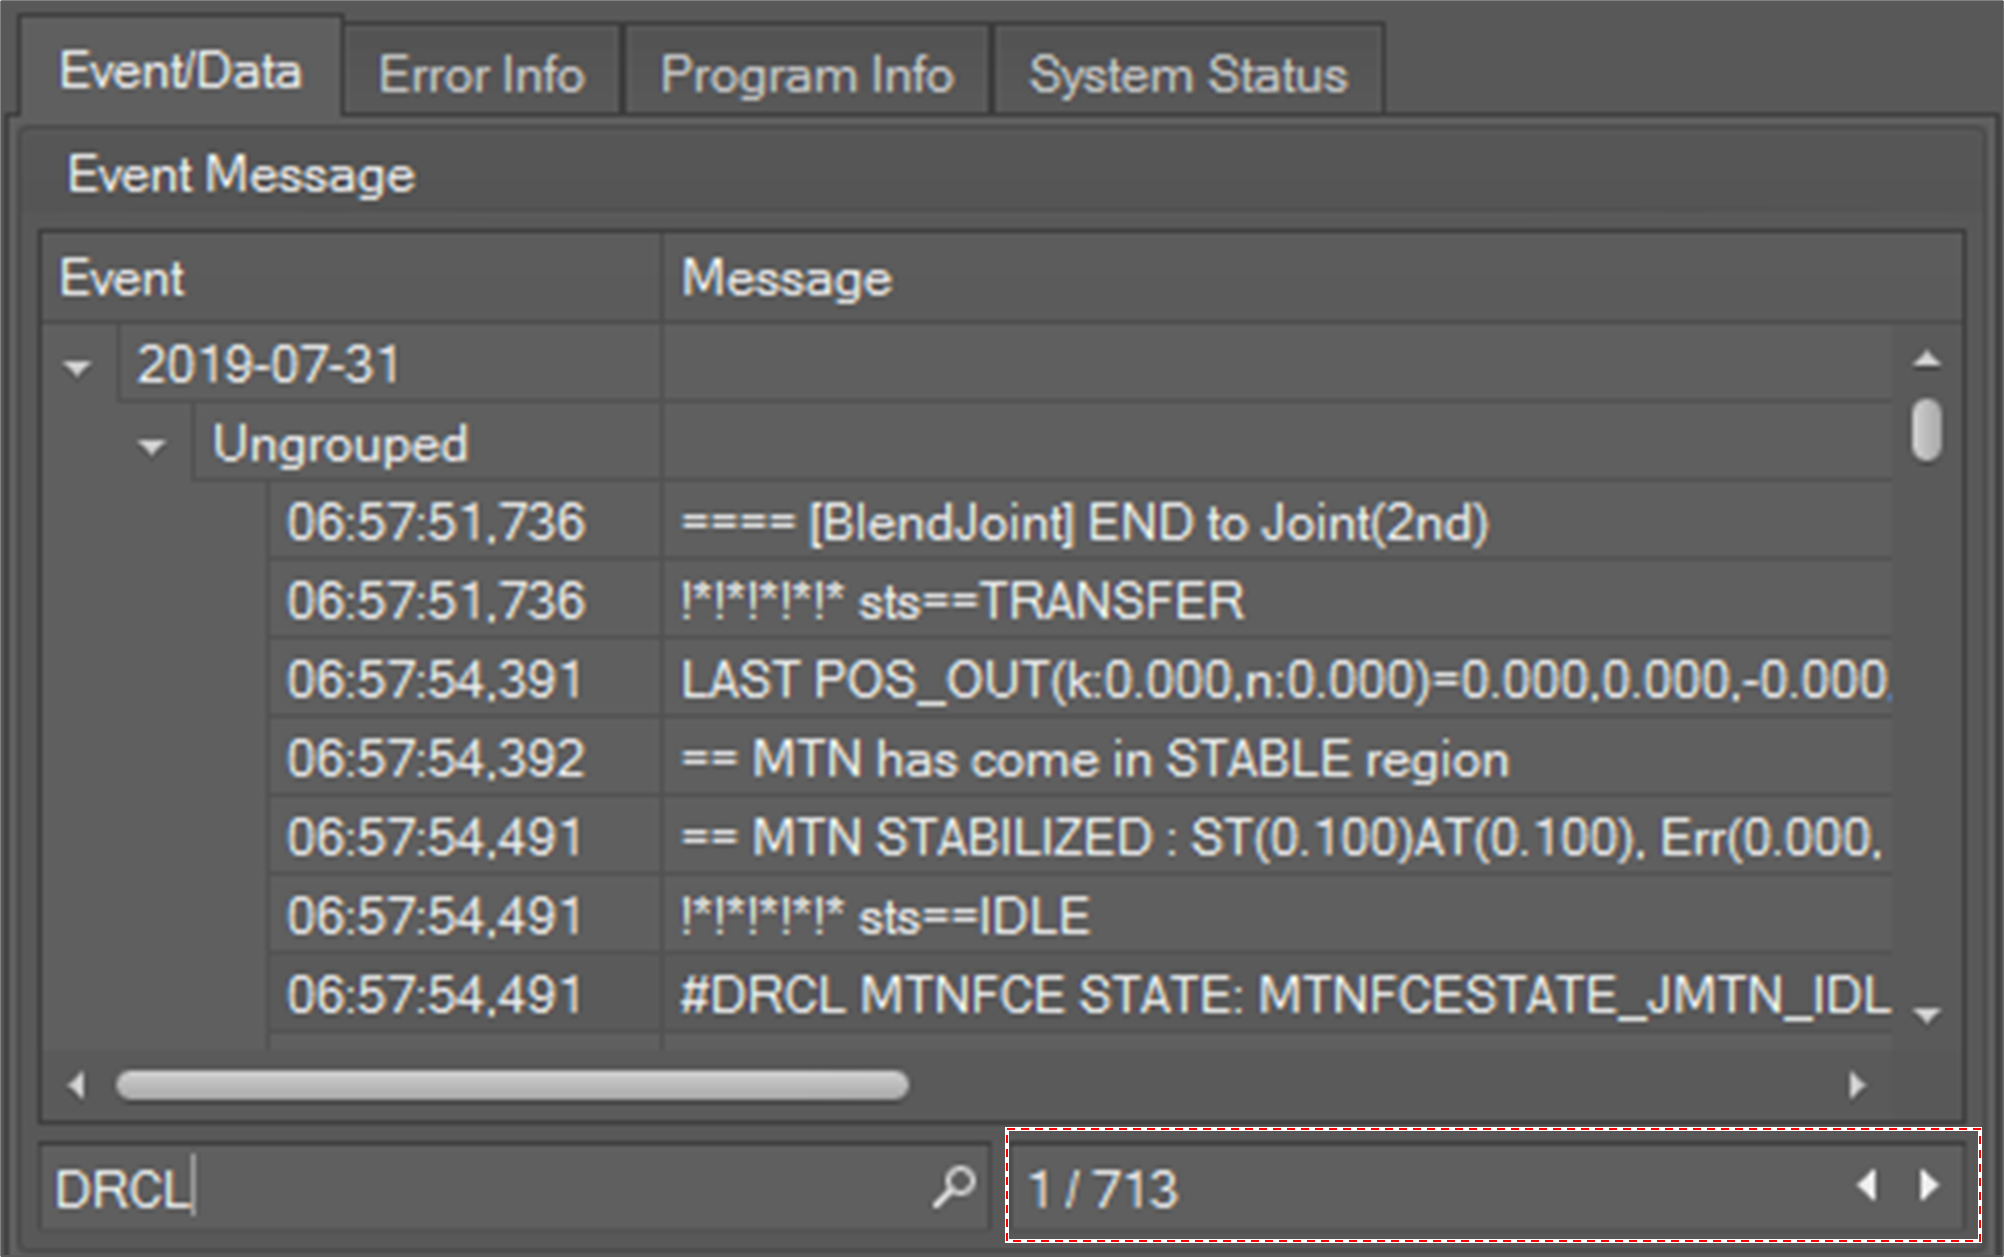
To search text in the event message,
-
Click the

-
The total search result count is displayed in the result field.
-
To see the next search result, click the Go to Next Result ▷ The next search result is displayed in the table. To see the previous search result, click the Go to Previous Result ◁ button.
You can also use the data chart at the bottom to check the data chart at the time of the error as shown below.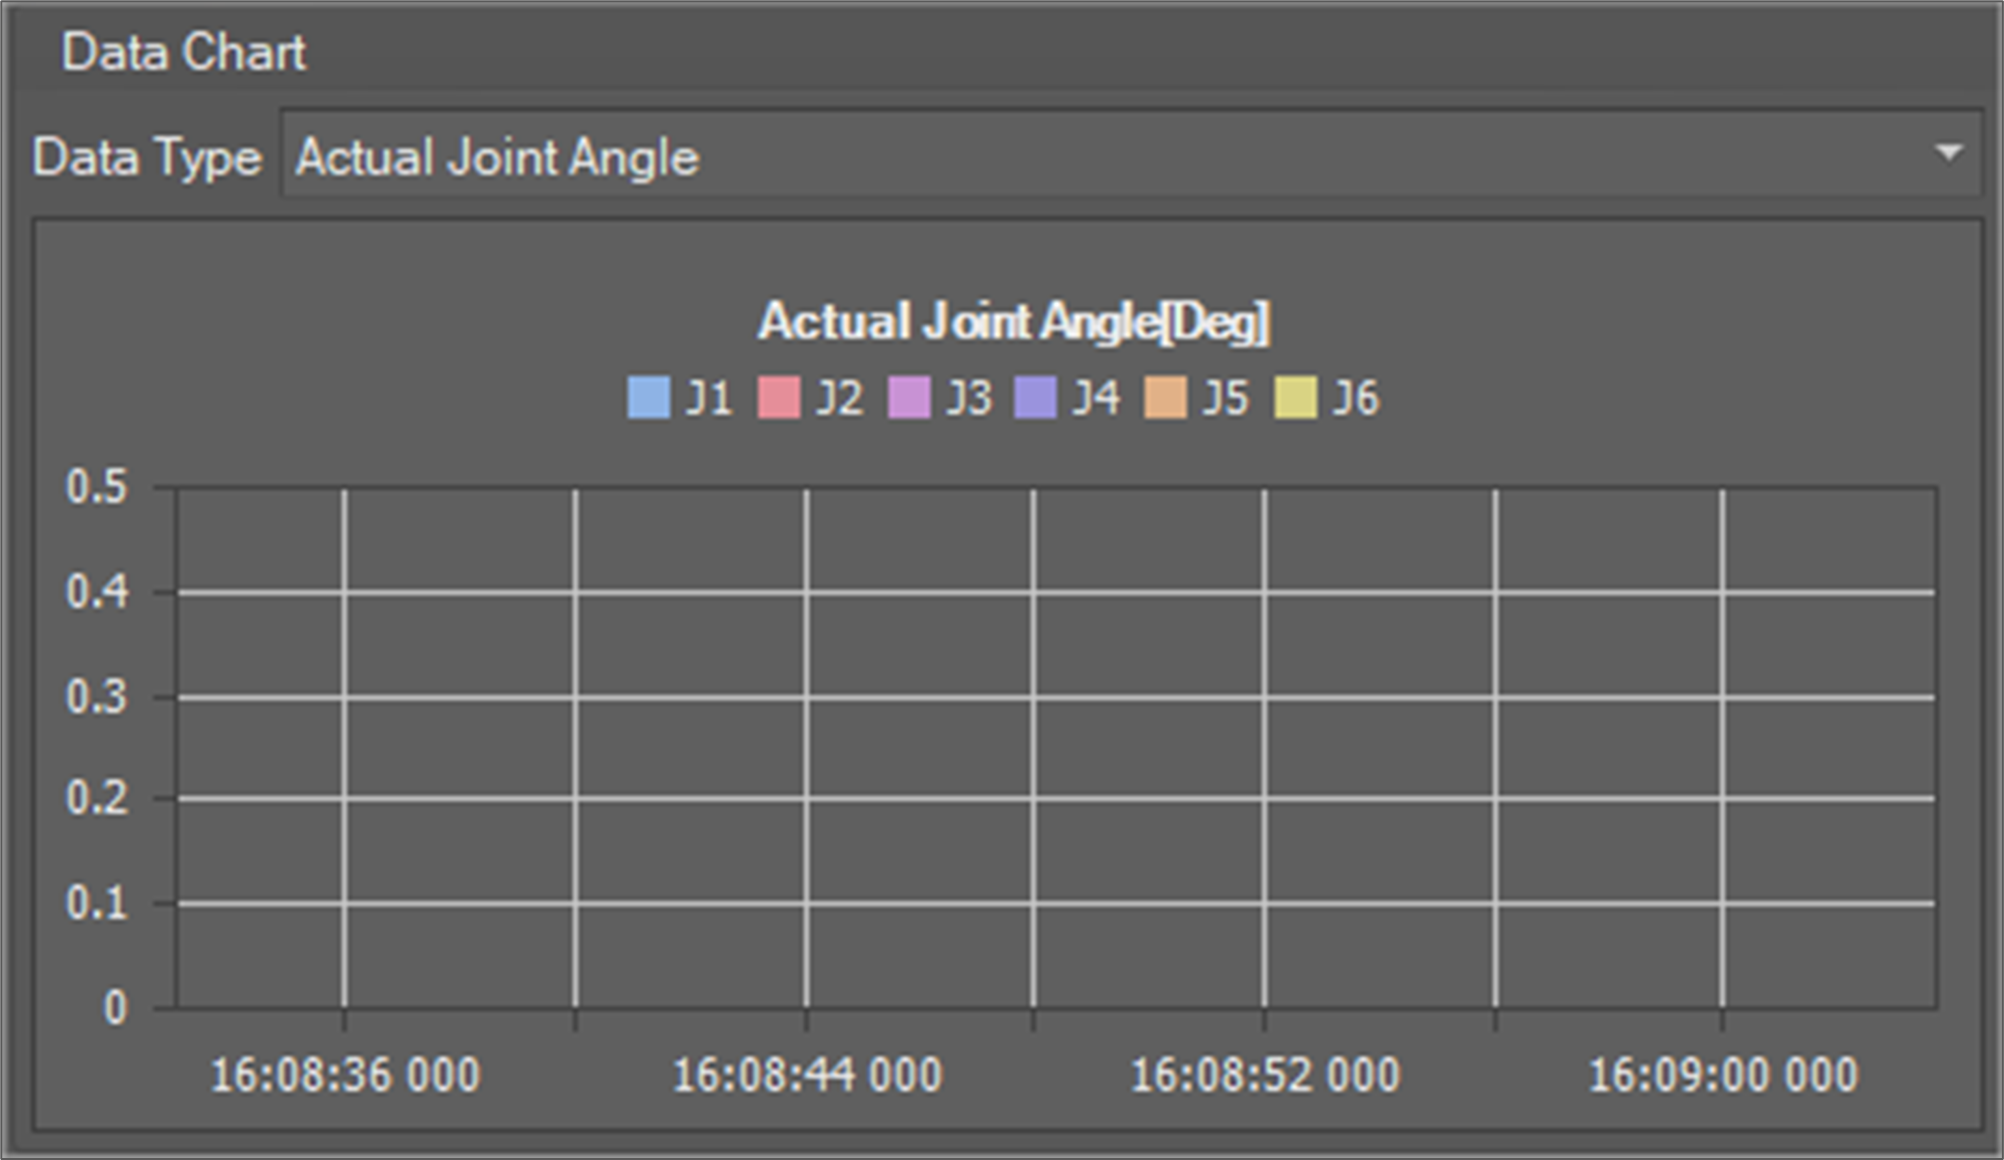
Fault Error Information
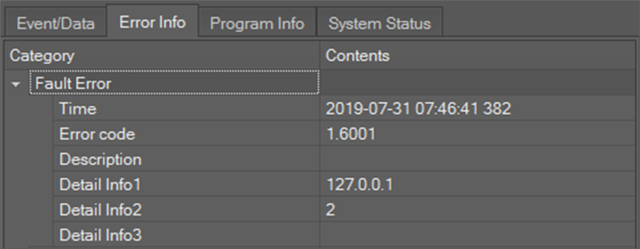
The Error Info tab shows information about the error that invoked the fault.
The Fault Error field shows detailed error information that invoked the fault. It shows the error occurrence time, error code and detailed error information.
-
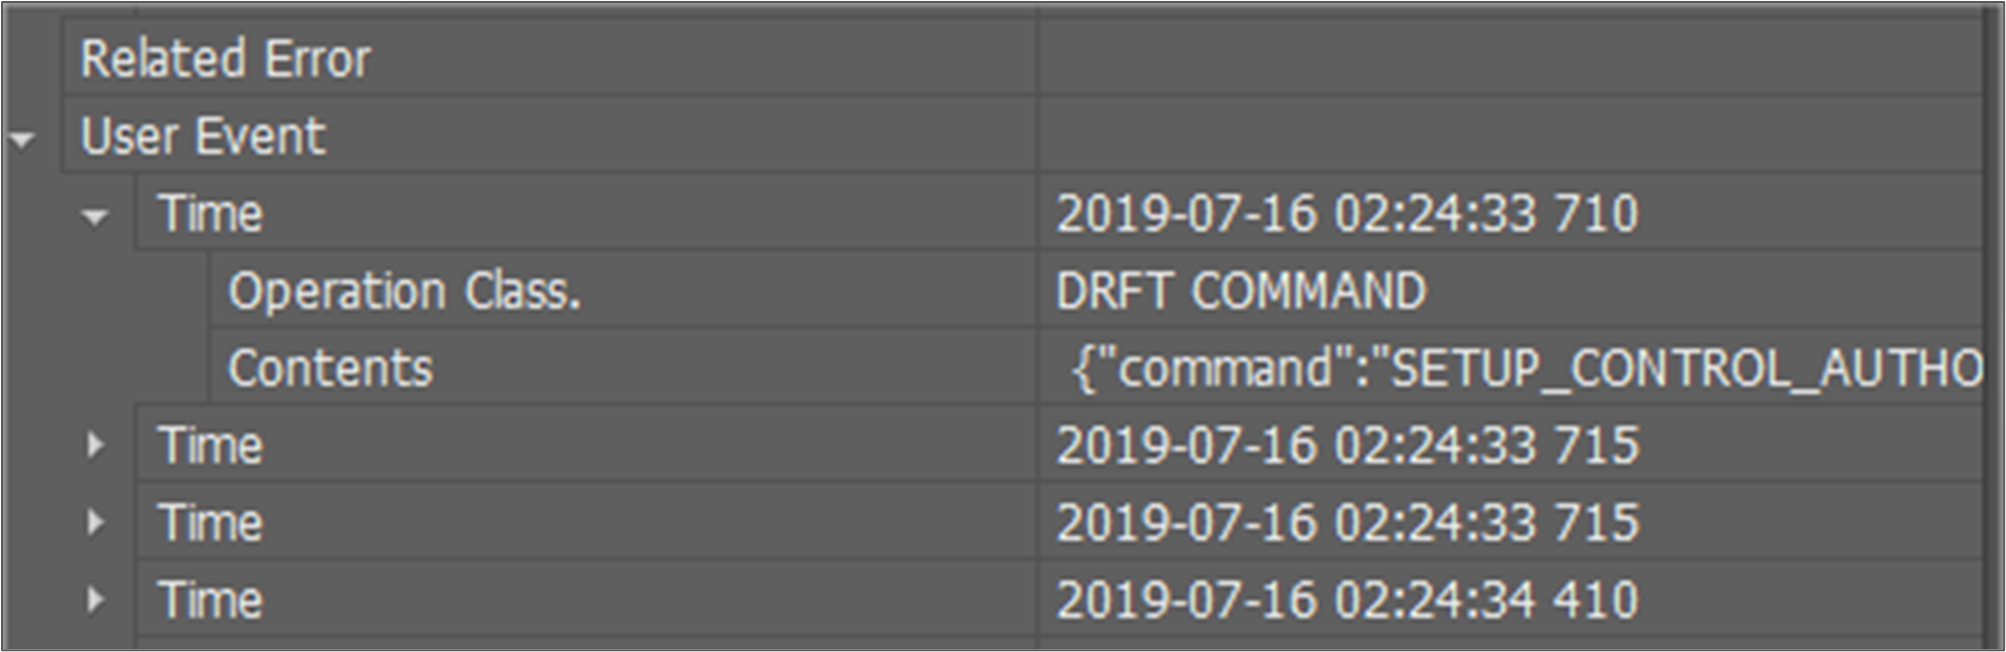
The Related Error field shows errors following the fault error.
-
The User Event field shows commands from TP and I/O events from 10 seconds before a fault.
Program Information
If a fault occurs while running the program, the corresponding program code and running information is shown in the Program Info tab.
The Start Time/Stop Time field shows program running time information.
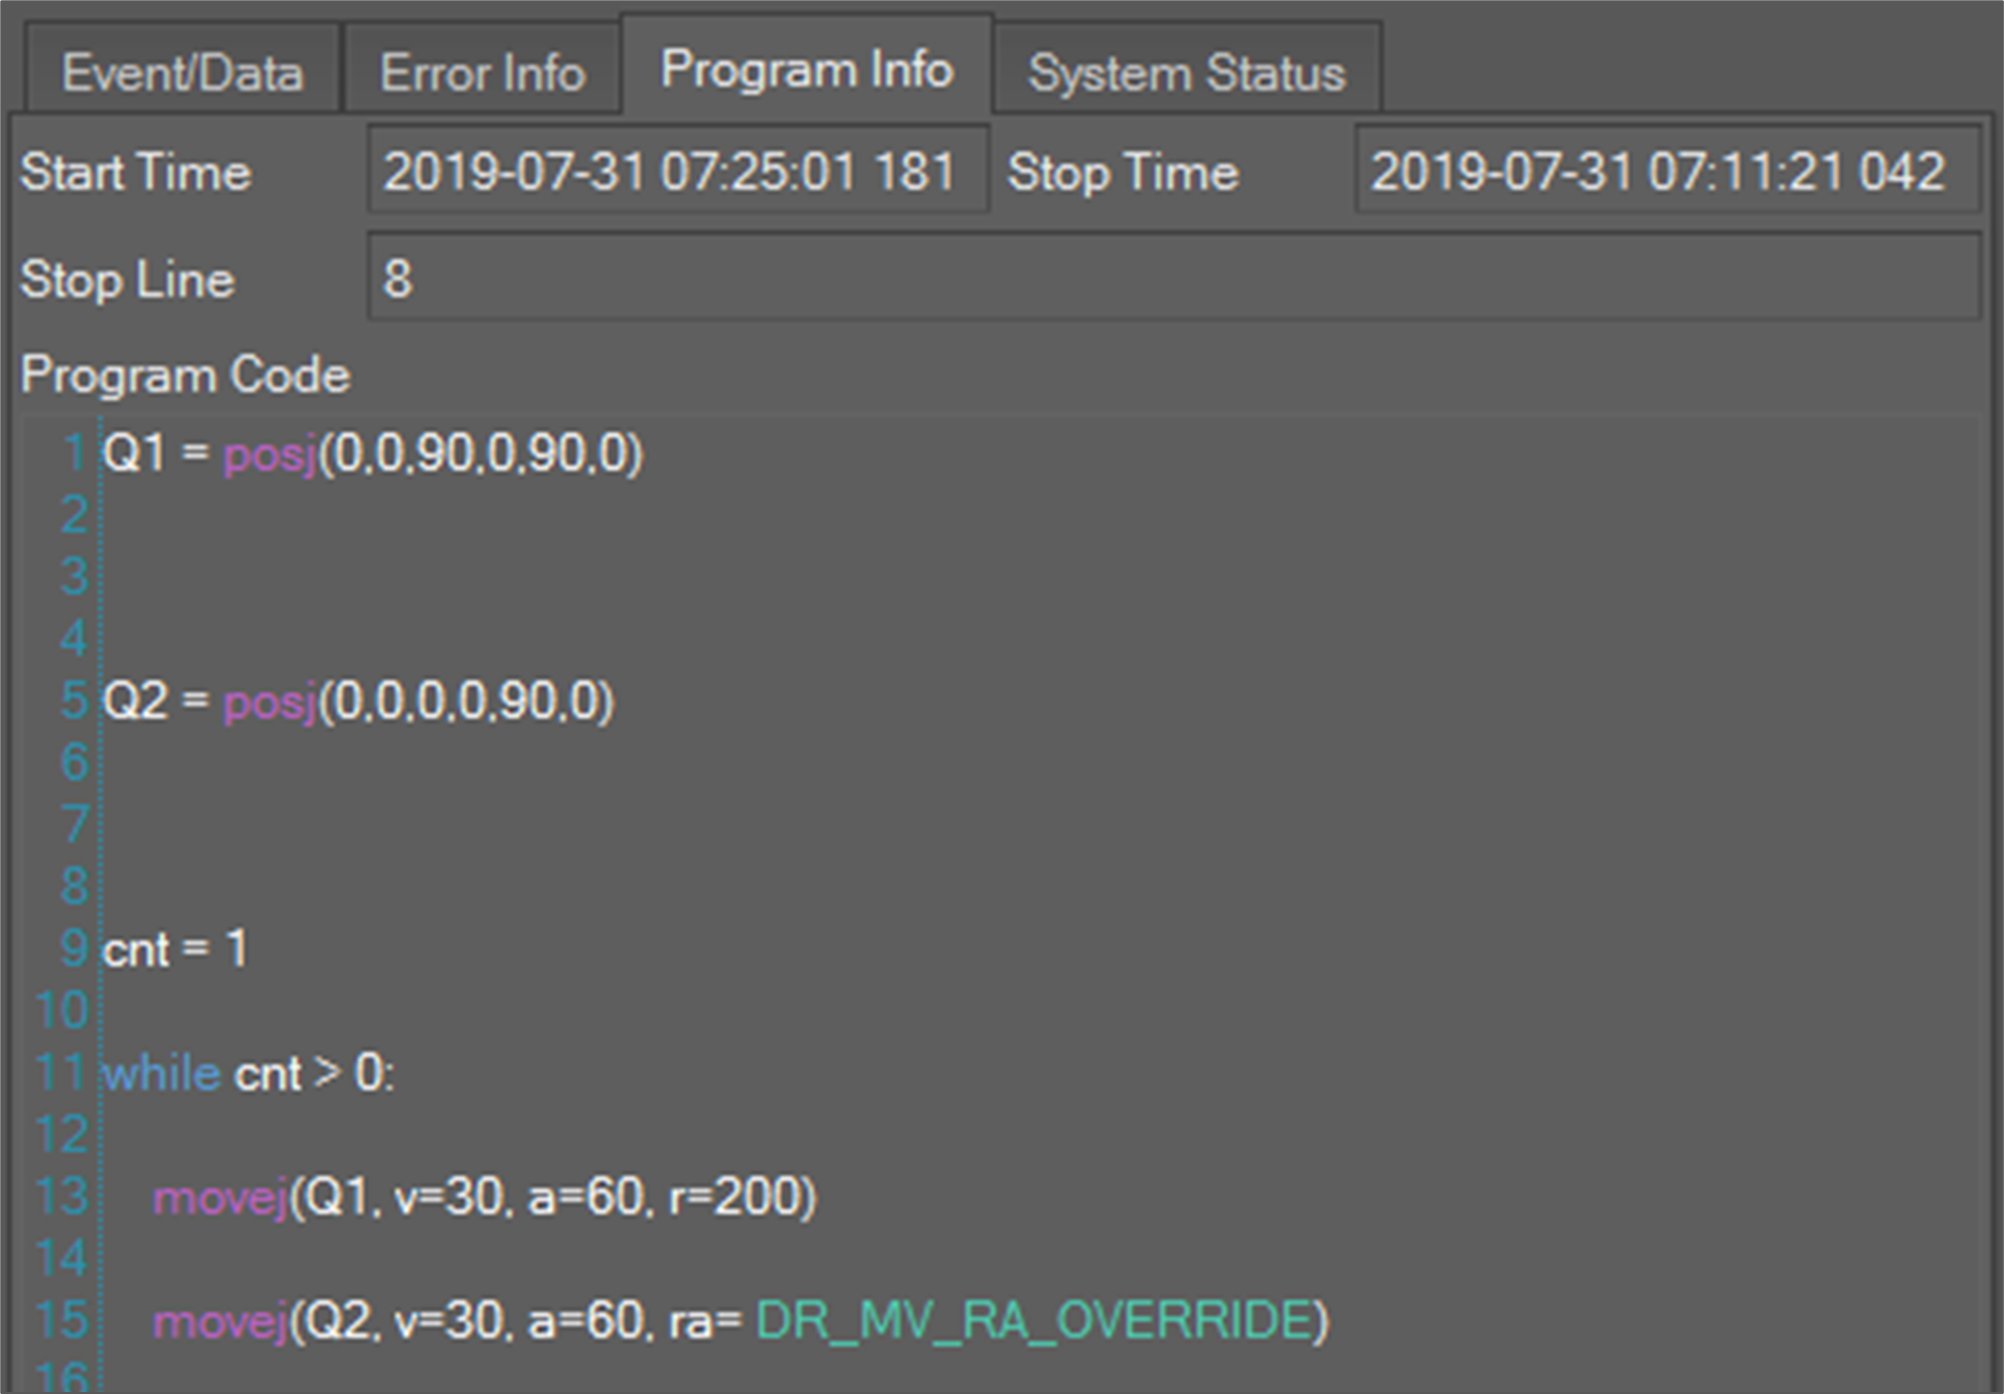
The Program Code field shows program code.
The Stop Line is where the program stopped.
System Status Information
The System Status tab shows system status and configuration information when the fault occurred. It shows information in a tree form
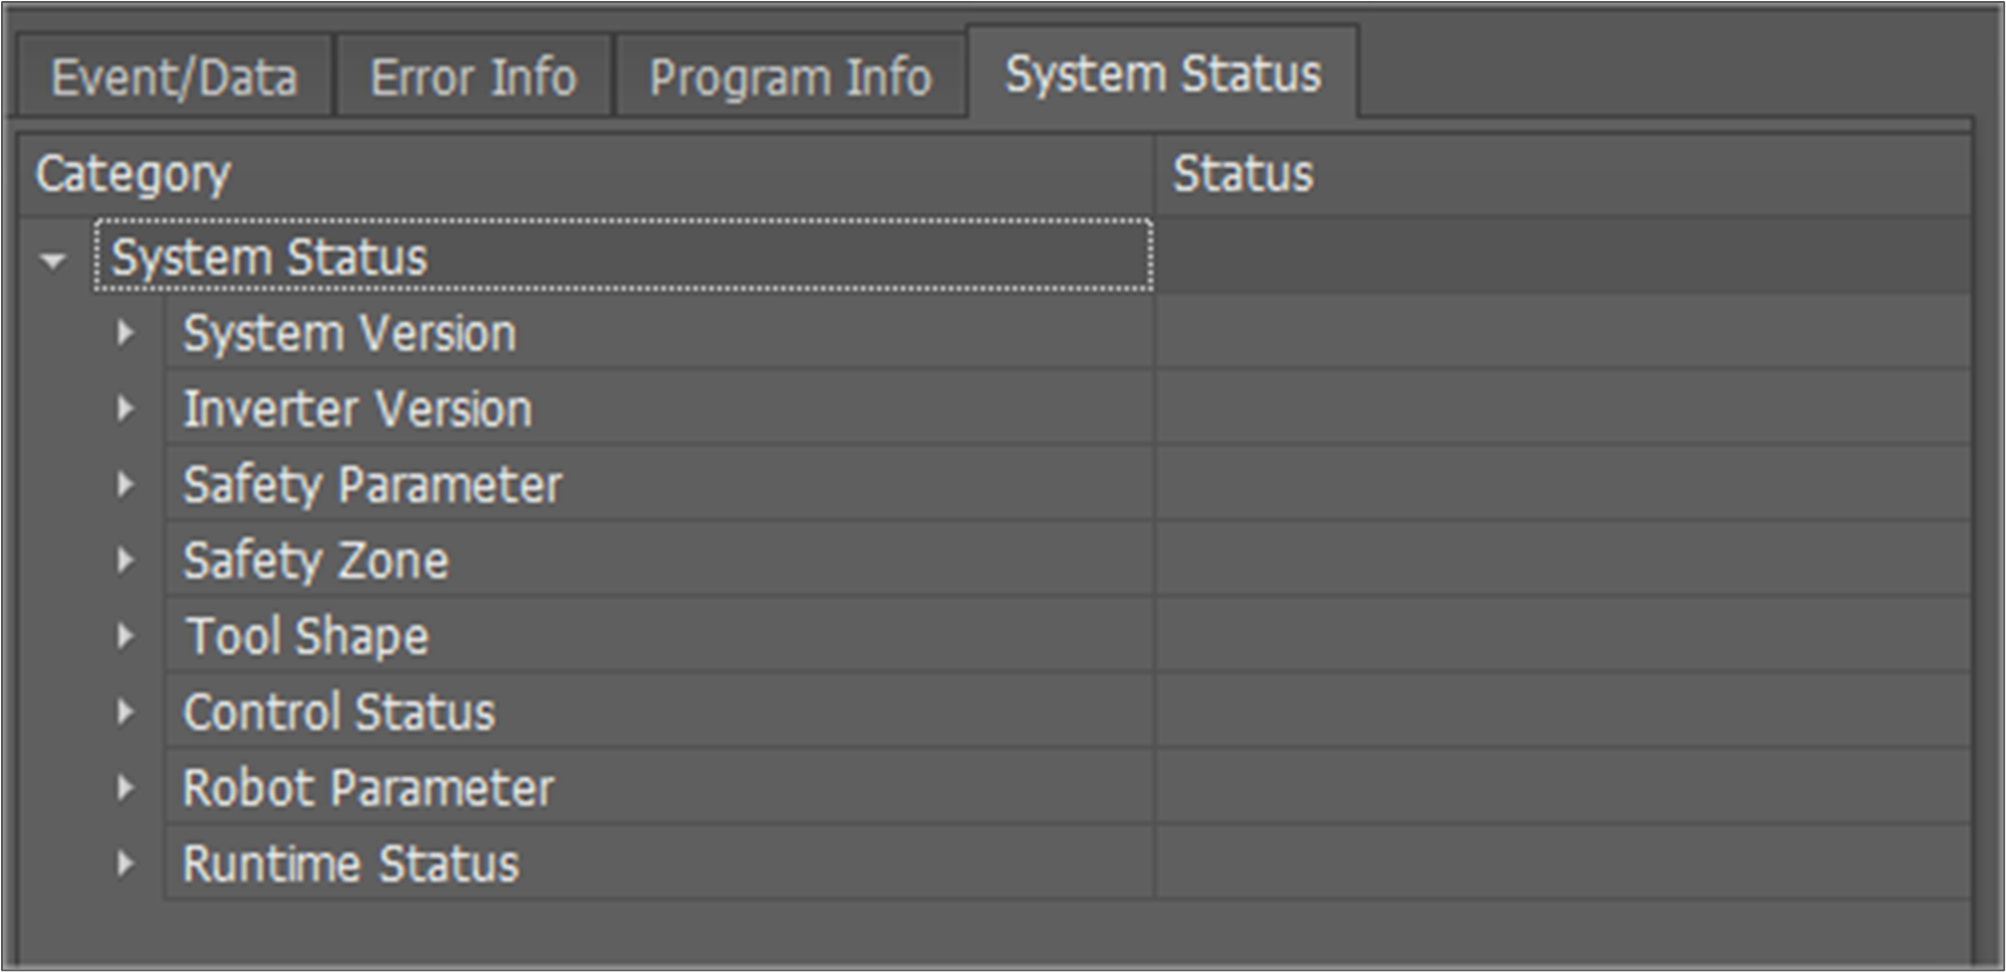
System status is composed of the categories below.
-
System Version: Version of controller SW and HW components.
-
Inverter Version: Version of inverter.
-
Safety Parameter: Safety configuration.
-
Safety Zone: Safety configuration.
-
Tool Shape: Safety configuration.
-
Control Status: System status when fault occurs.
-
Robot Parameter: Robot calibration information.
-
Operation History: Accumulative robot operation information.