-
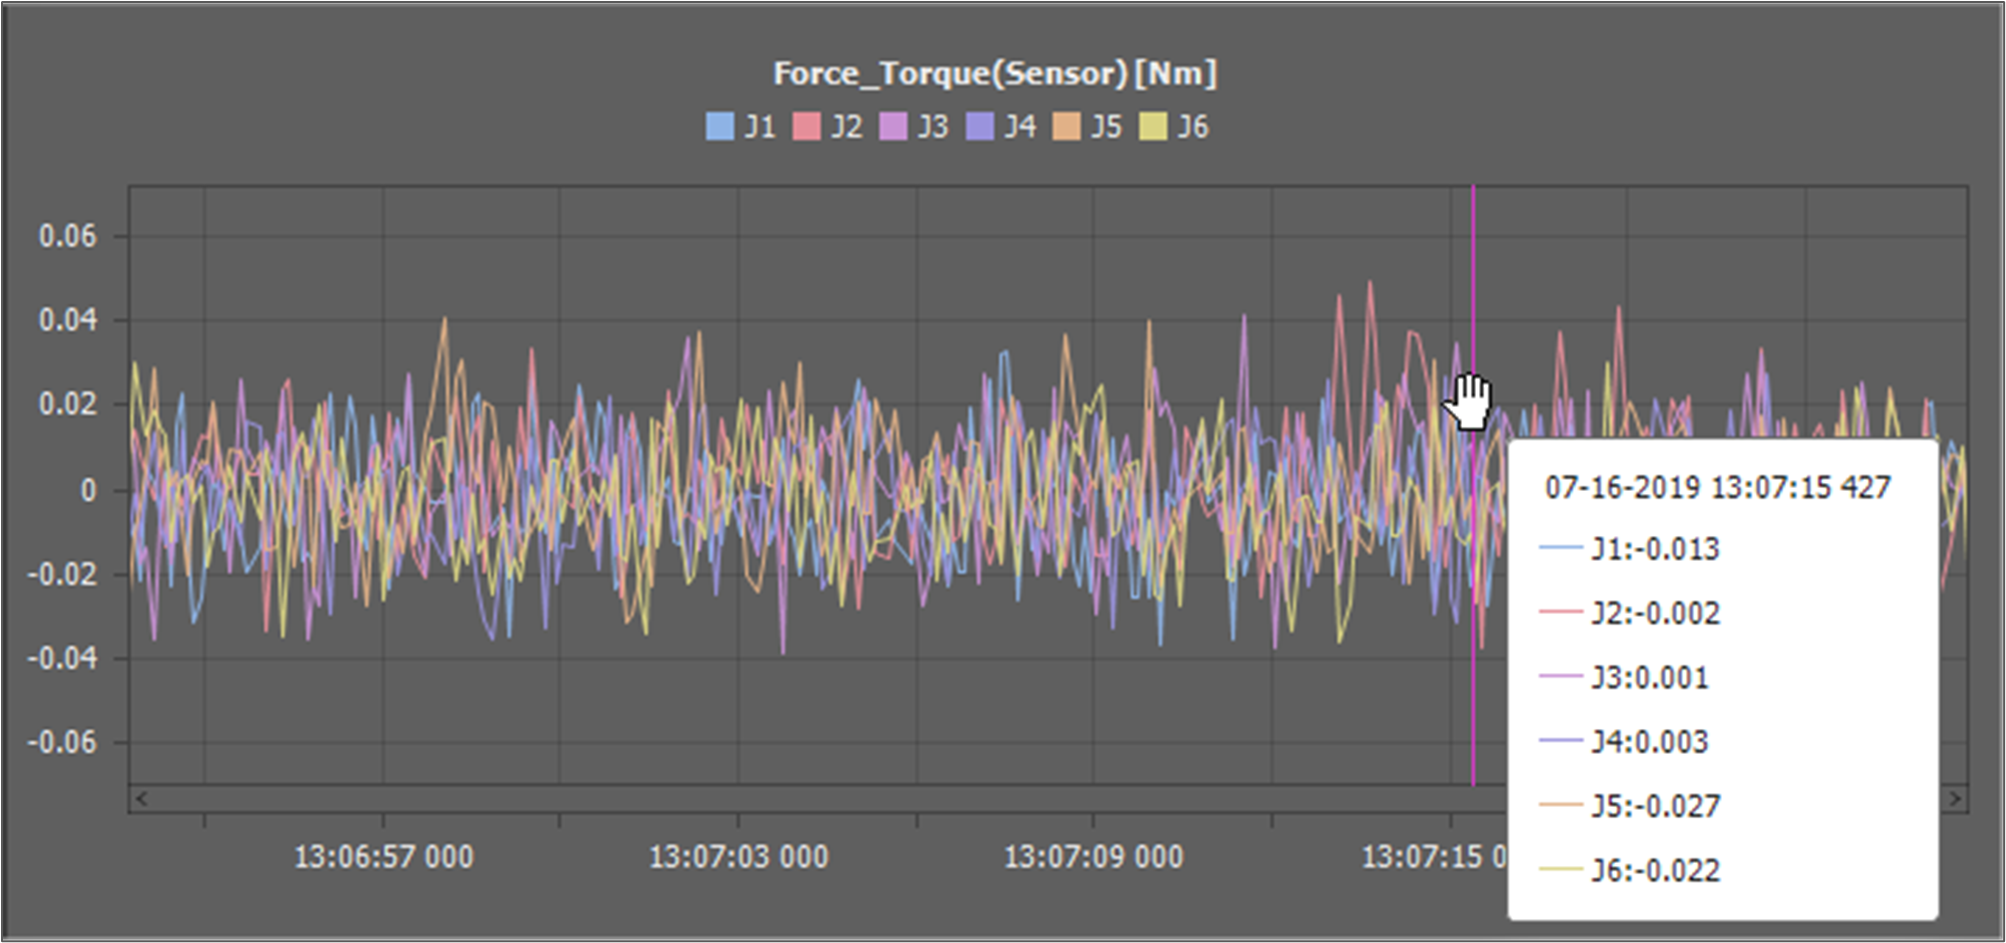
Value Cursor: If you move the mouse cursor over the graph, the value of the mouse cursor position is shown in the tooltip.
-
X-Direction Zoom In: Scroll the mouse wheel upward while the mouse cursor is over a graph.
-
X-Direction Zoom Out: Scroll the mouse wheel downward while the mouse cursor is over a graph.
-
Y-Direction Zoom In: Scroll the mouse wheel upward while the mouse cursor is over a graph and holding down the Ctrl key.
-
Y-Direction Zoom Out: Scroll the mouse wheel downward while the mouse cursor is over a graph and holding down the Ctrl key.
-
Move: Use the scroll to move the data window position. Or move the mouse cursor to the left or right while pushing the left mouse button.
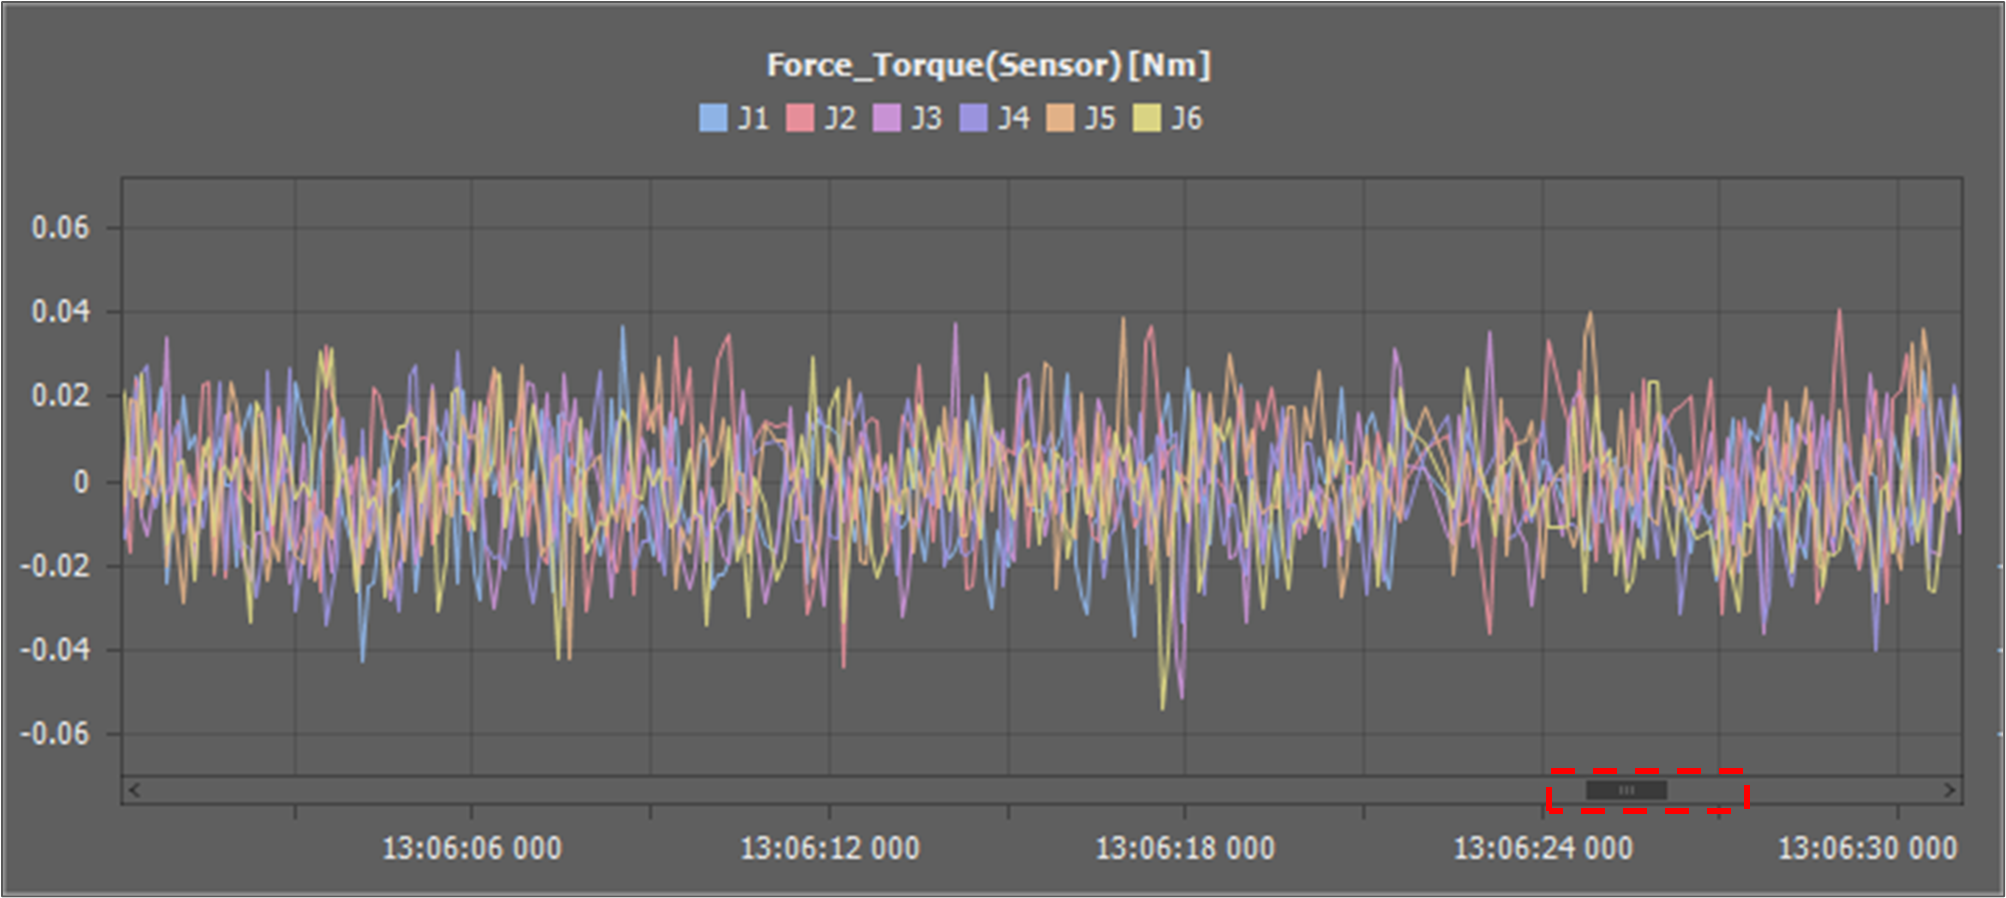
If the data window doesn’t include the new data position, the graph is fixed. If you move the data window so that it includes the new data position, it starts to flow.