
Slave Monitoring

스크린샷 2025-07-10 오후 3.06.01.png


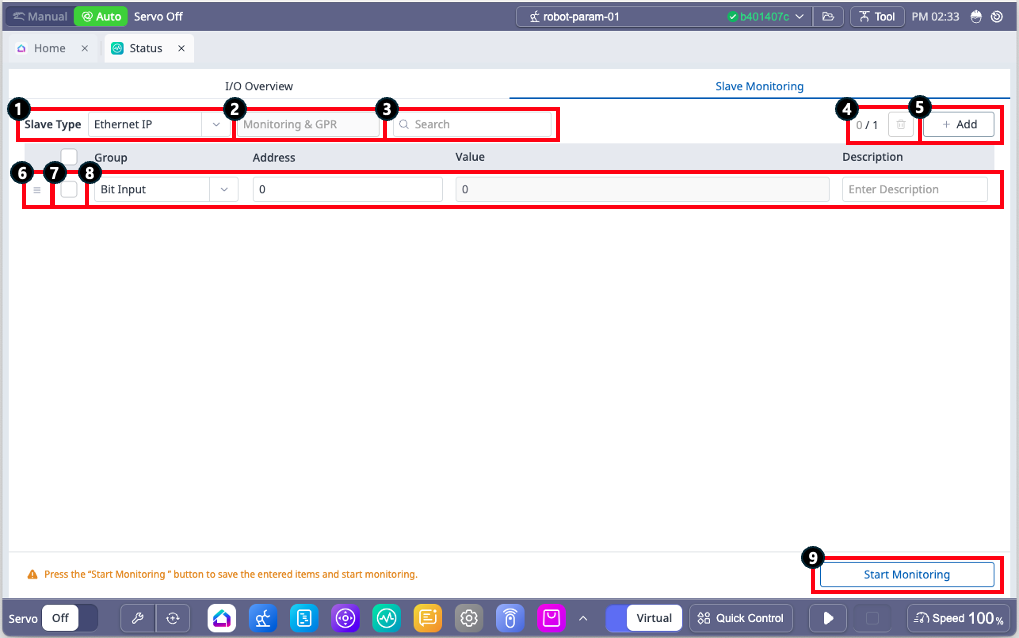
1

Slave Type

Change the communication method for monitoring.

  • You can select one among Modbus, Ethernet IP, or Profinet.

2

Ethernet Adapter Type

Check the Adapter Type of the currently configured Ethernet IP.


  • The setting can be configured in the PLC menu of the Setting module.

3

Search

Search register data being monitored.

  • The Value and Description containing the entered value will be the search targets.

4

Remove monitoring data

Remove data with activated check boxes.

  • The number on the left displays the count of currently selected data and the total data count.

5

Add monitoring data

Add monitoring data.

  • Up to 1,000 entries can be added.

6

Reorder


A button to change the order of data.

  • Hold and drag the button to rearrange the data order.

7

Check Box

Select the data to be removed.

8

Data setting

Configure the group, address, description, and display method for the monitoring data.


    • For Ethernet IP, the selectable mode changes according to the adapter type set in the PLC mode in the Setting module.

    • For Profinet, the menu is fixed based on Monitoring & GPR.


9

Start/Stop Monitoring

This button allows starting or stopping the monitoring process.

  • When monitoring starts, all fields except Slave Type, Search Box, and Description are disabled.

  • Monitoring will end if the Stop Monitoring button is clicked, navigation to I/O Overview occurs, or the status module is closed.

  • Monitoring cannot be started if there is no monitoring data for any Slave Type or if invalid data exists due to changes in the Ethernet IP's Adapter Type.