
Graph Window
Status monitoring information is provided as a graph in the Graph window.
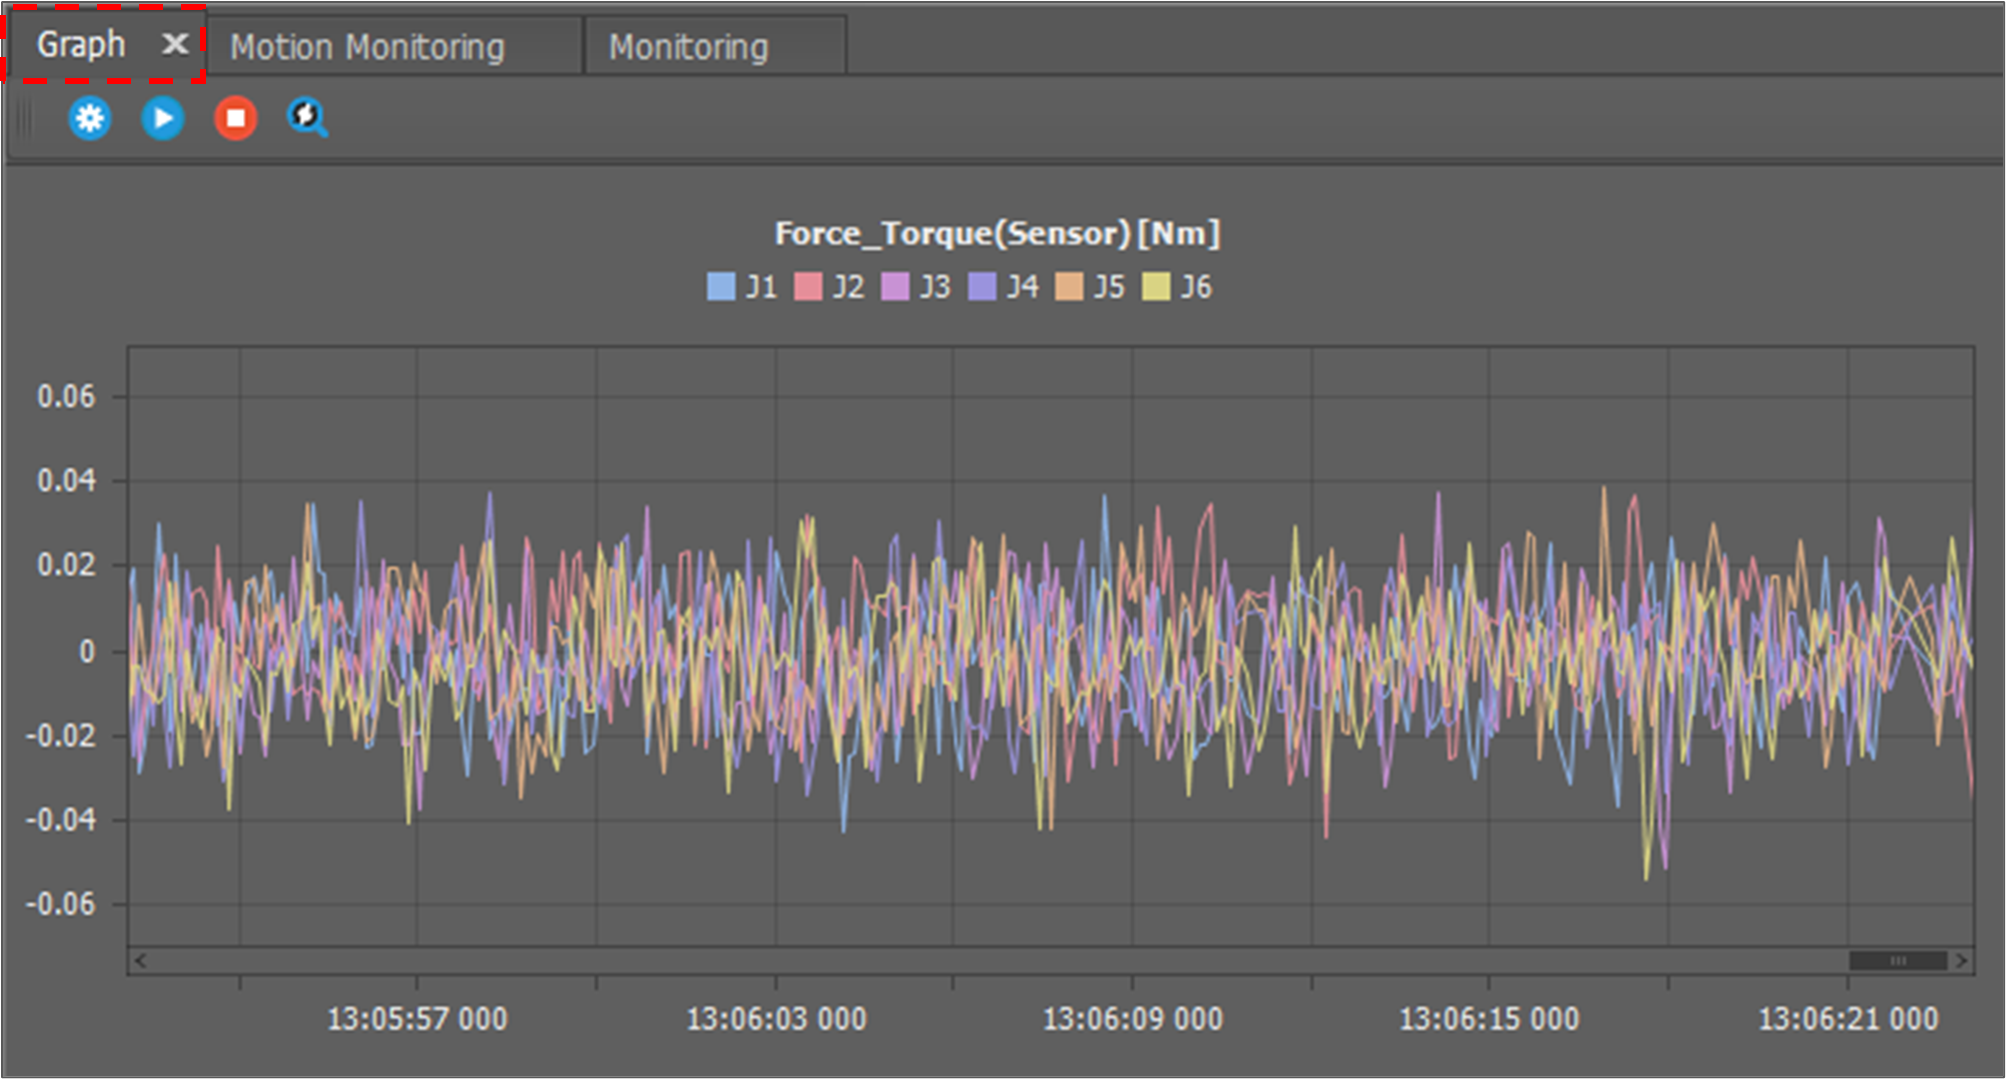
In each data graph, the X axis is time in milliseconds and the Y axis is the value of the data. Data is updated every 100 milliseconds and as new data is added, the graph flows from right to left.